This webpage contains PNGs of all the diagrams related to the project. Please scroll down or select a diagram from the menu above.
Near Real-Time Monitoring of Relative Velocity Changes Using Ambient Seismic Noise Across Great Britain - Diagrams
Velina Valova
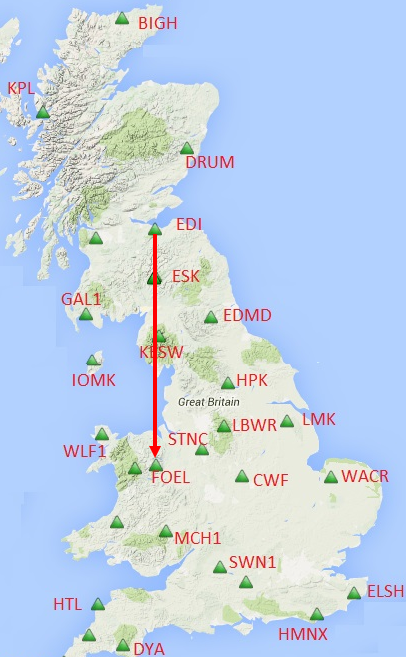
EDI-FOEL
Map, showing the direction of cross-correlation between station pair EDI-FOEL with the resulting cross-correlation gathers below.
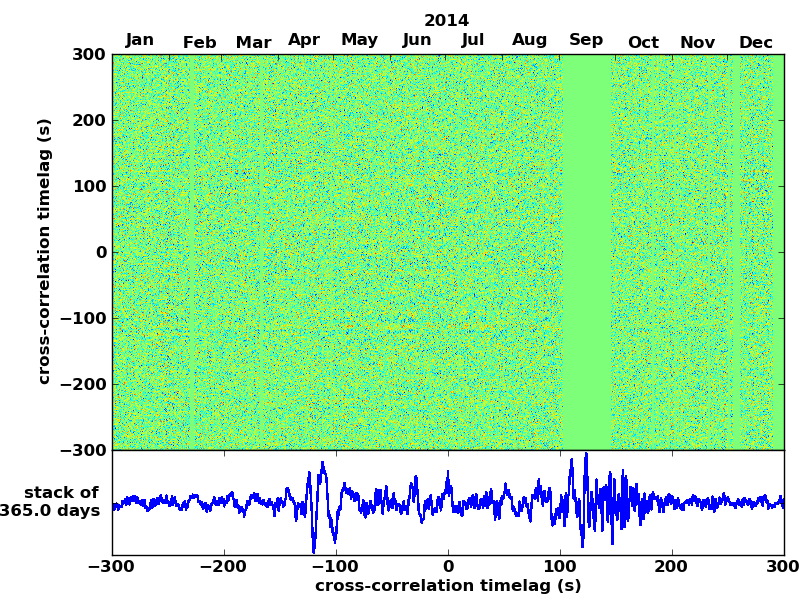
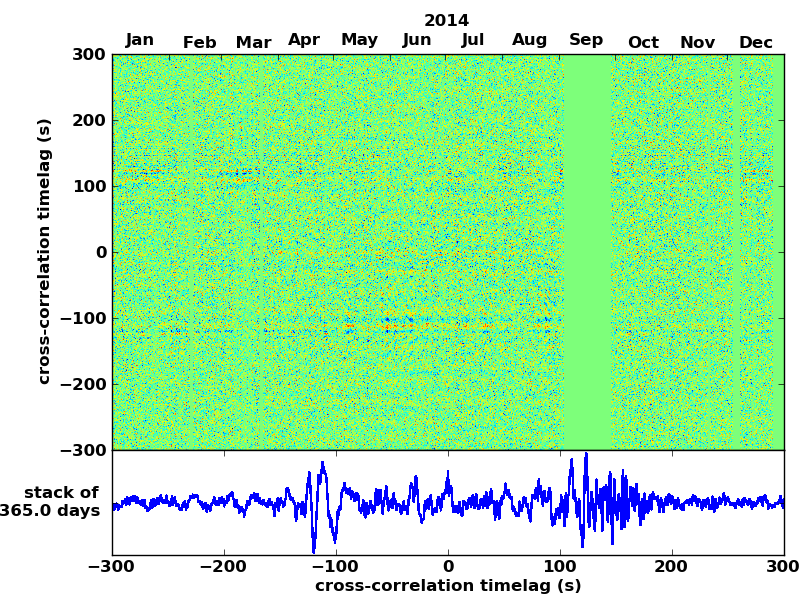
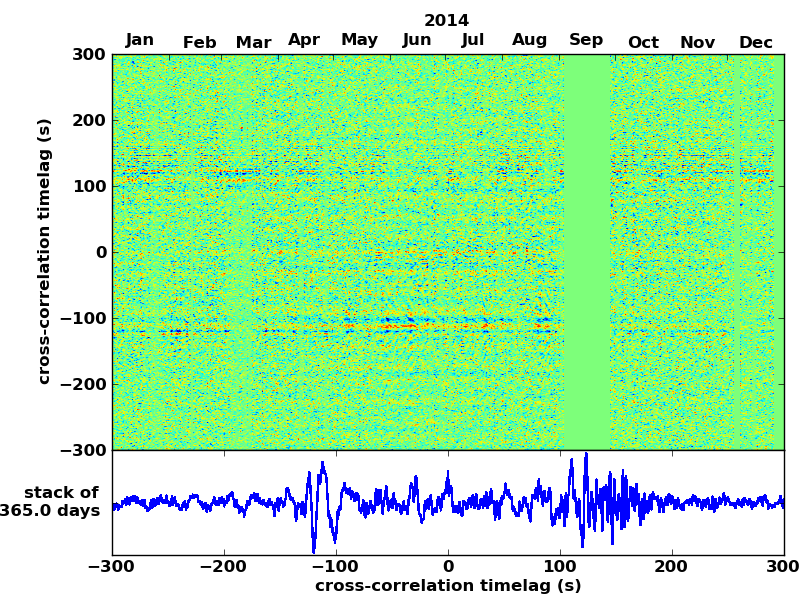
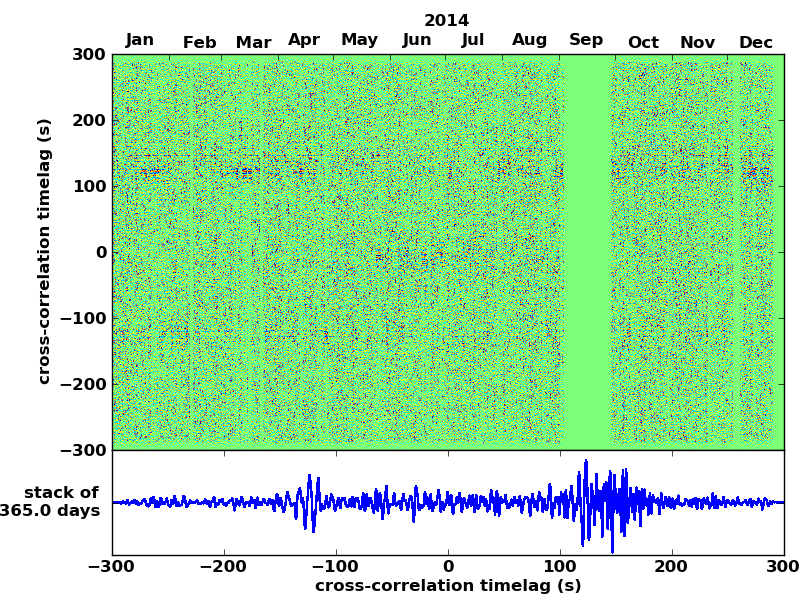
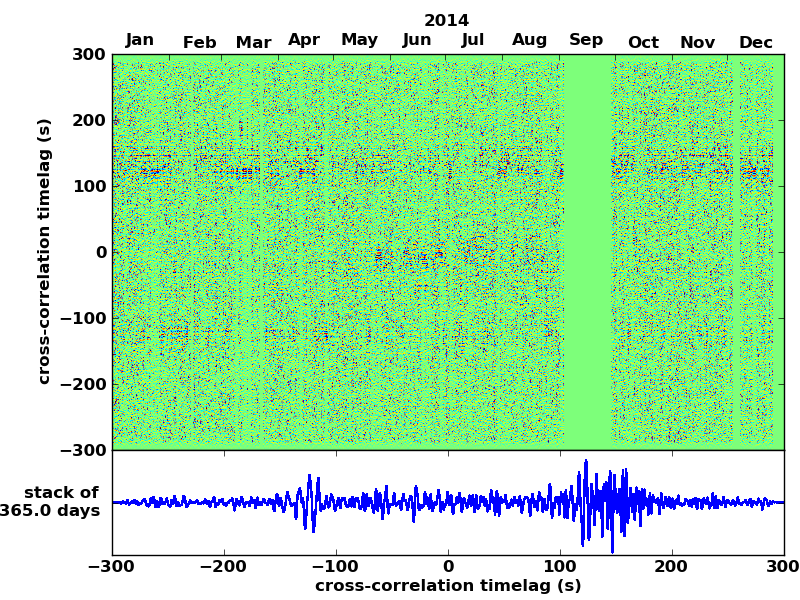
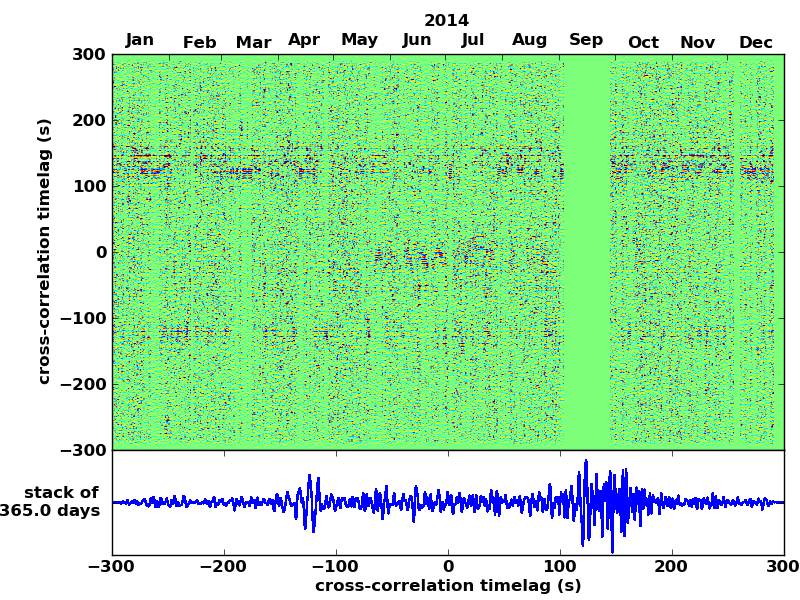
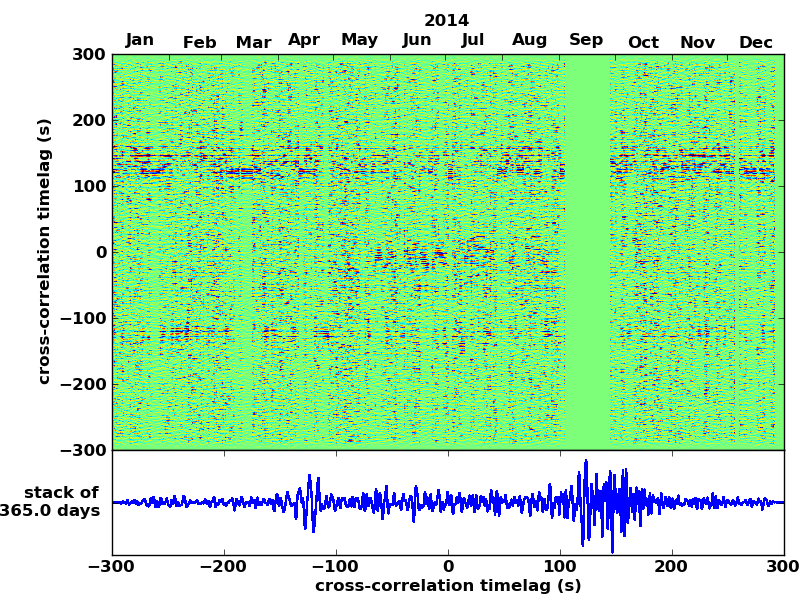
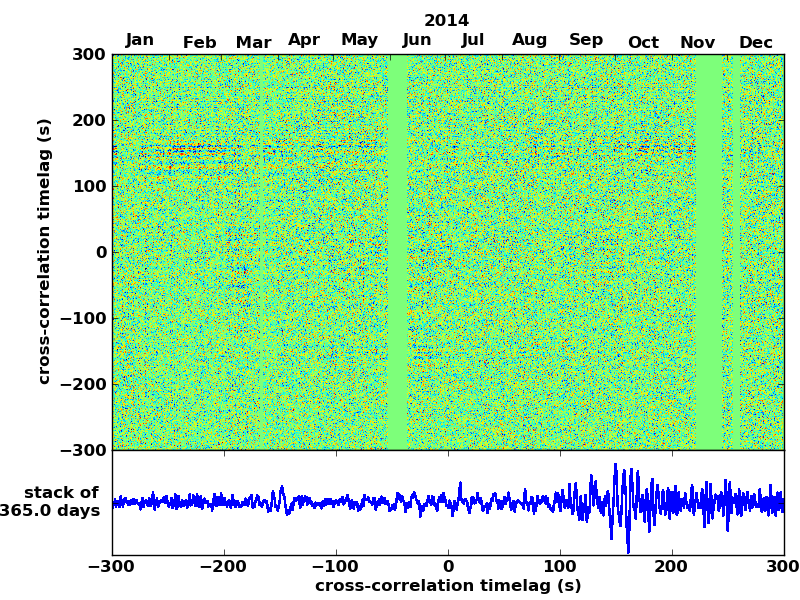
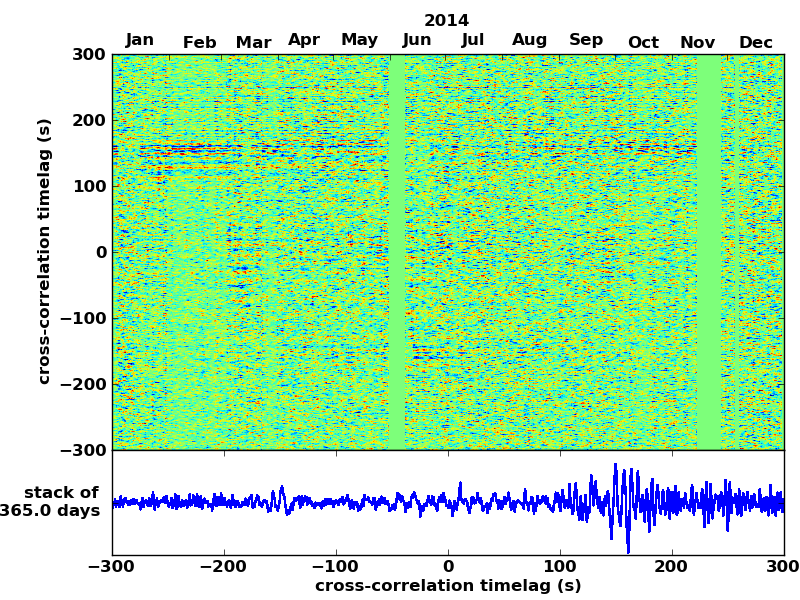
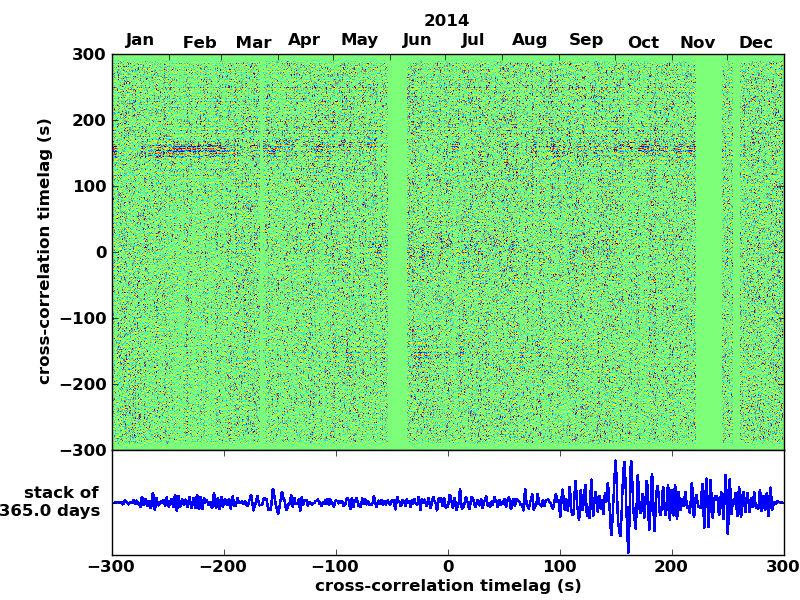
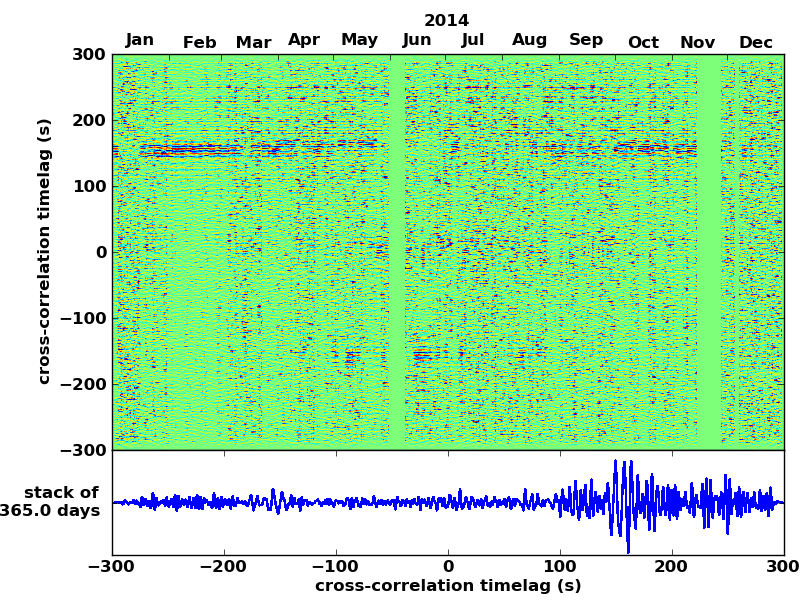
Full frequency spectrum of EDI-FOEL
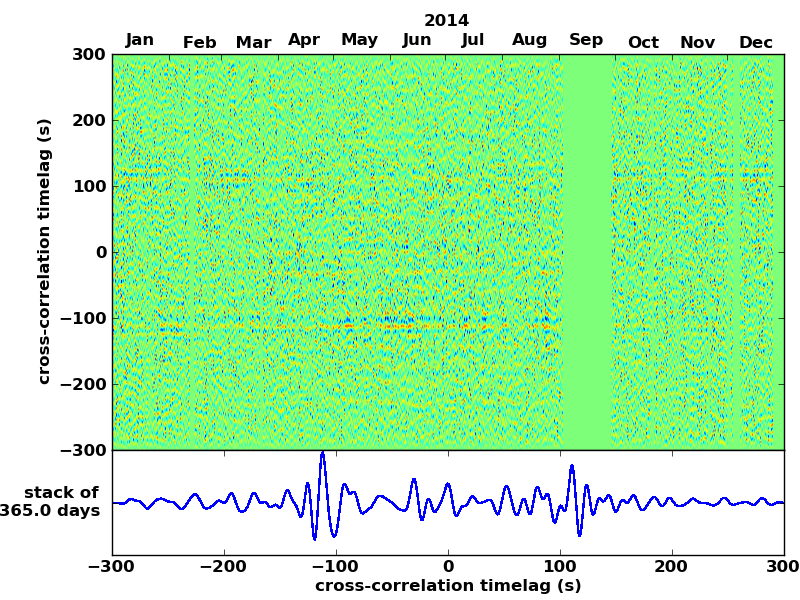
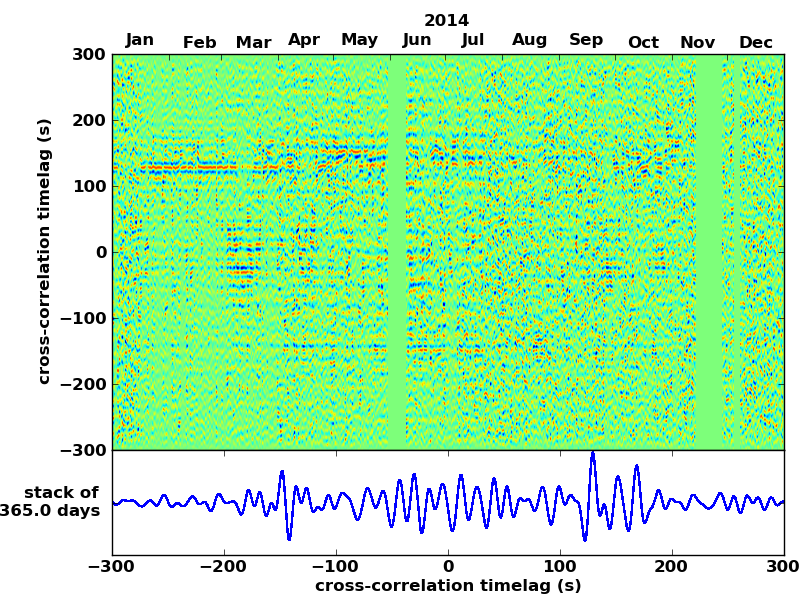
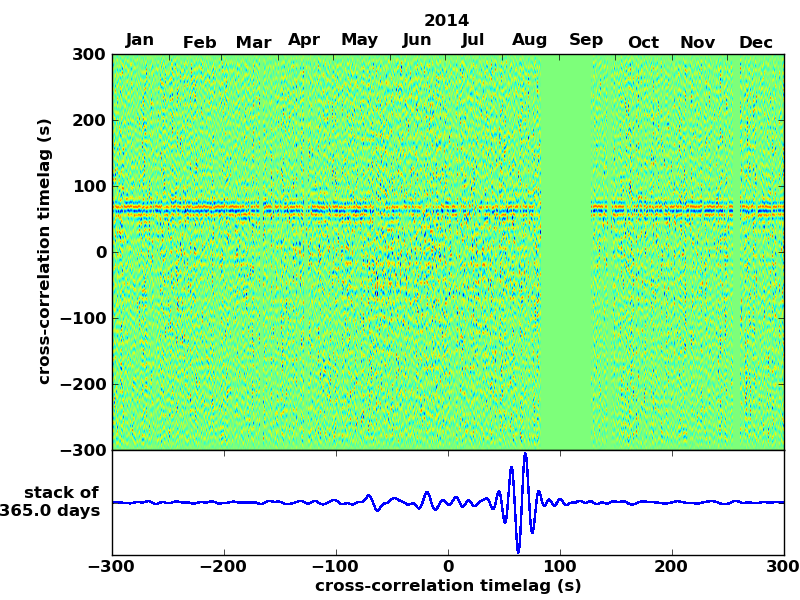
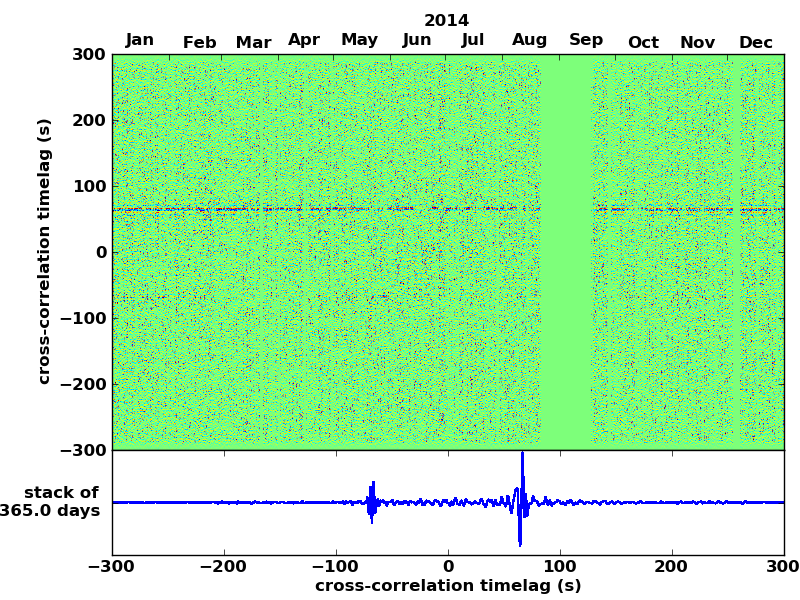
Station pair – EDI-FOEL, 0.02-1.00 Hz, 1 hour running average
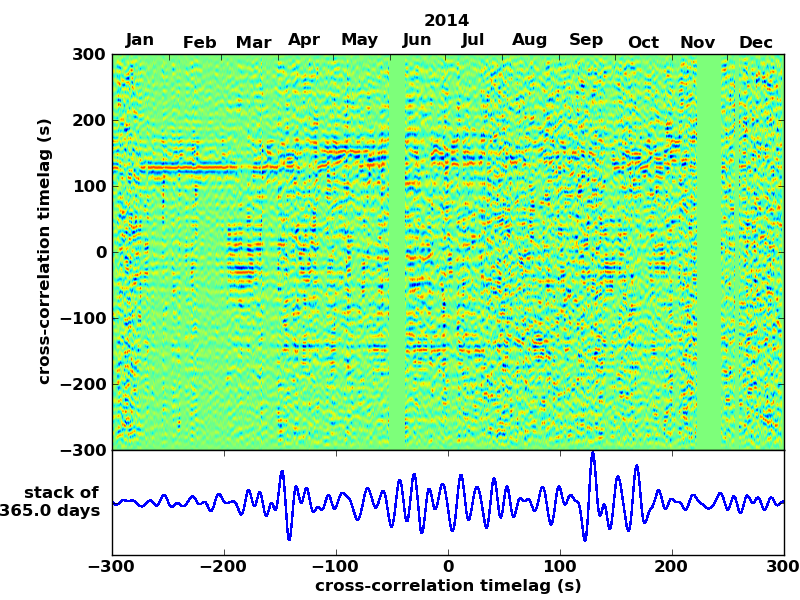
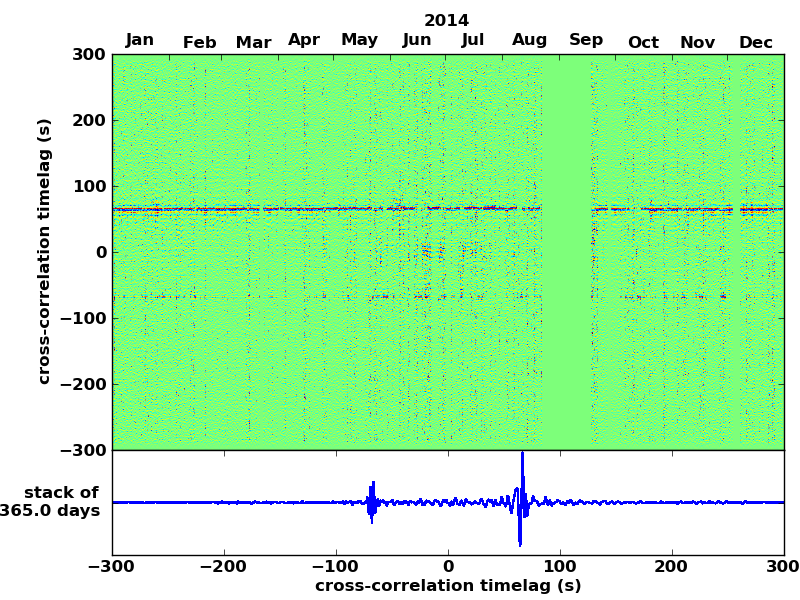
Station pair – EDI-FOEL, 0.02-1.00 Hz, 2 hour running average
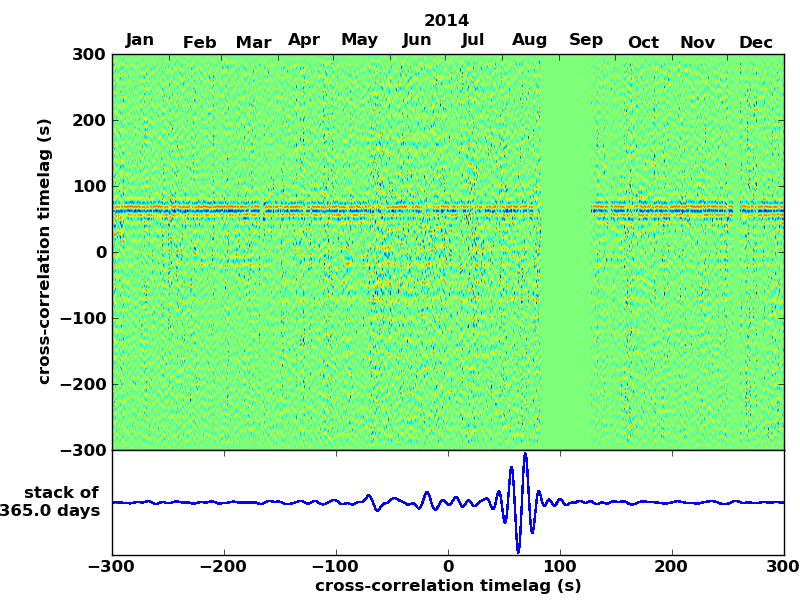
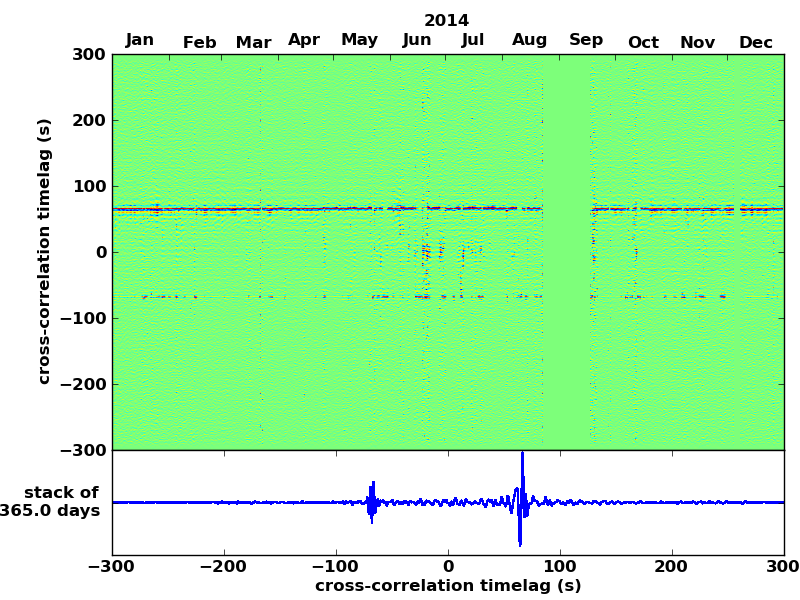
Station pair – EDI-FOEL, 0.02-1.00 Hz, 6 hour running average
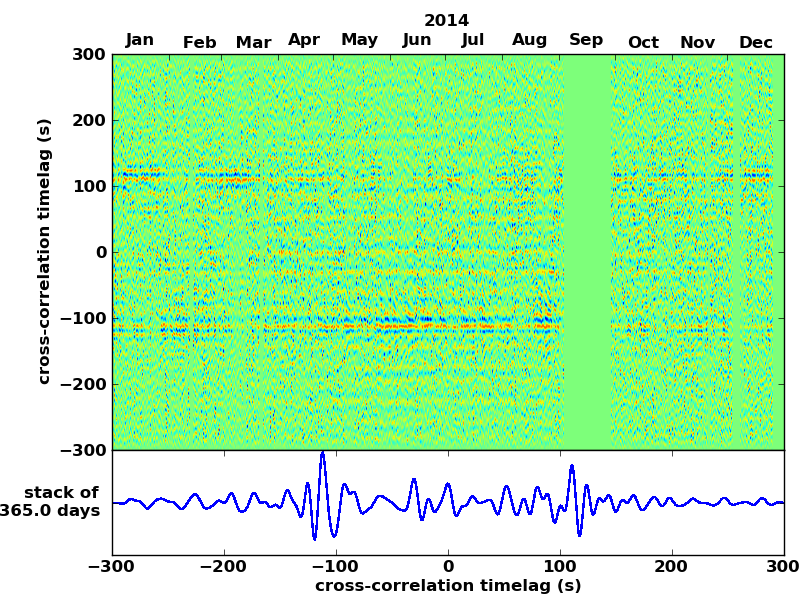
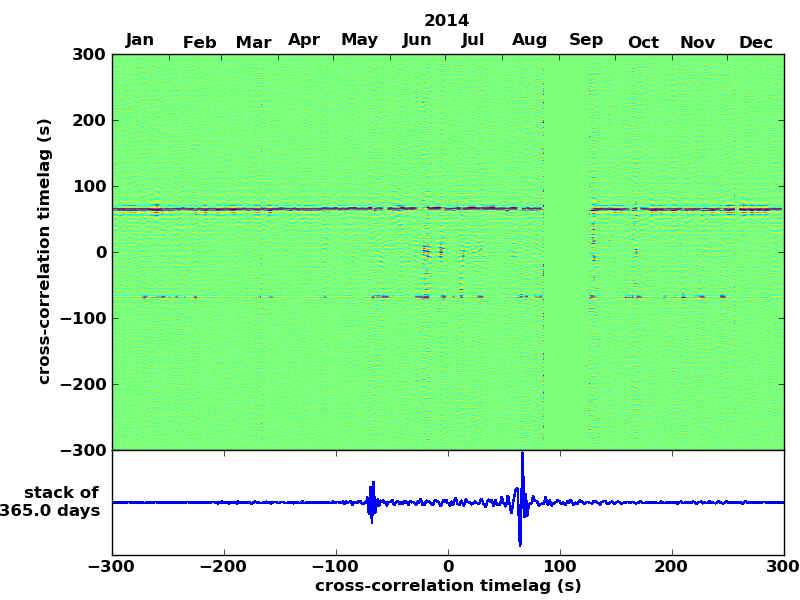
Station pair – EDI-FOEL, 0.02-1.00 Hz, 12 hour running average
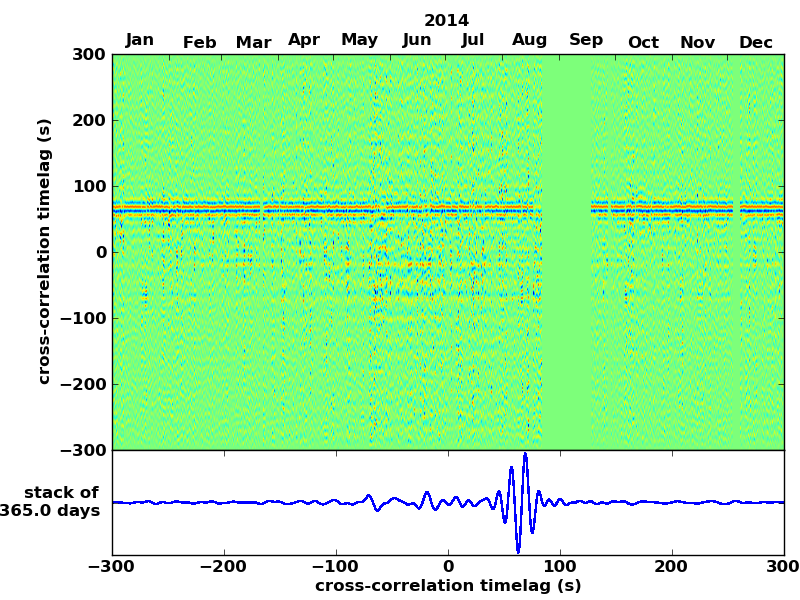
Station pair – EDI-FOEL, 0.02-1.00 Hz, 24 hour running average
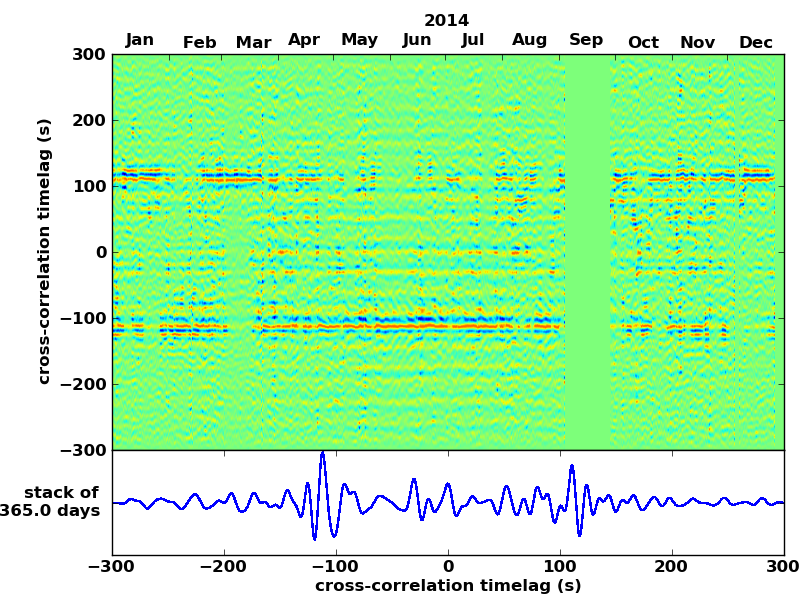
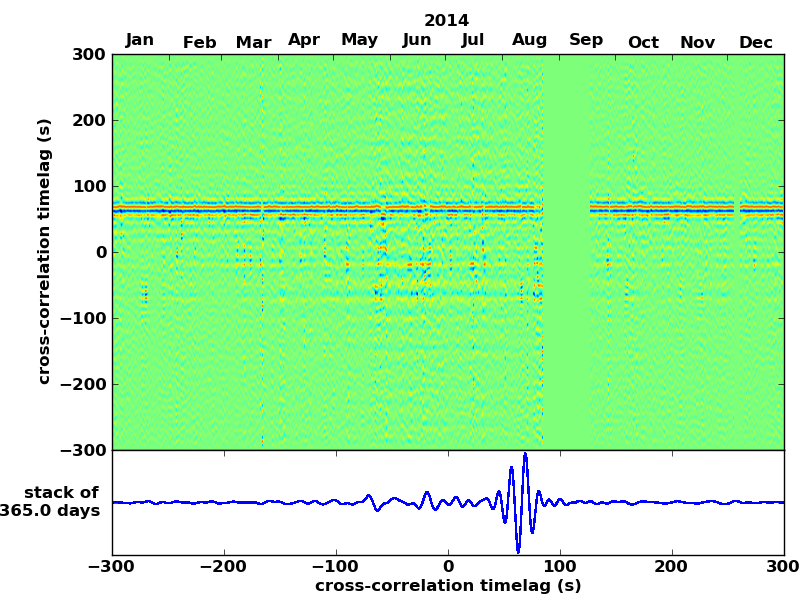
Station pair – EDI-FOEL, 0.02-1.00 Hz, 48 hour running average
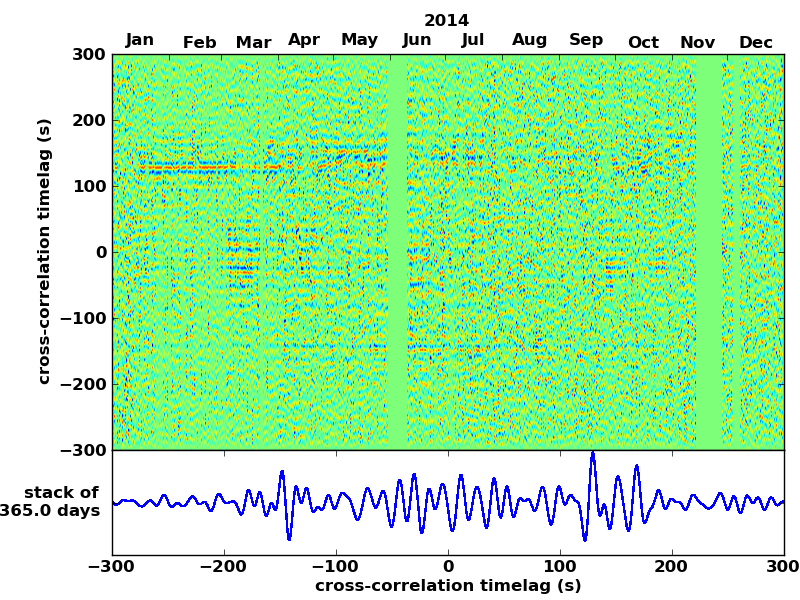
Low frequency band-pass of EDI-FOEL
Station pair – EDI-FOEL, 0.02-0.11 Hz, 1 hour running average
Station pair – EDI-FOEL, 0.02-0.11 Hz, 2 hour running average
Station pair – EDI-FOEL, 0.02-0.11 Hz, 6 hour running average
Station pair – EDI-FOEL, 0.02-0.11 Hz, 12 hour running average
Station pair – EDI-FOEL, 0.02-0.11 Hz, 24 hour running average
Station pair – EDI-FOEL, 0.02-0.11 Hz, 48 hour running average
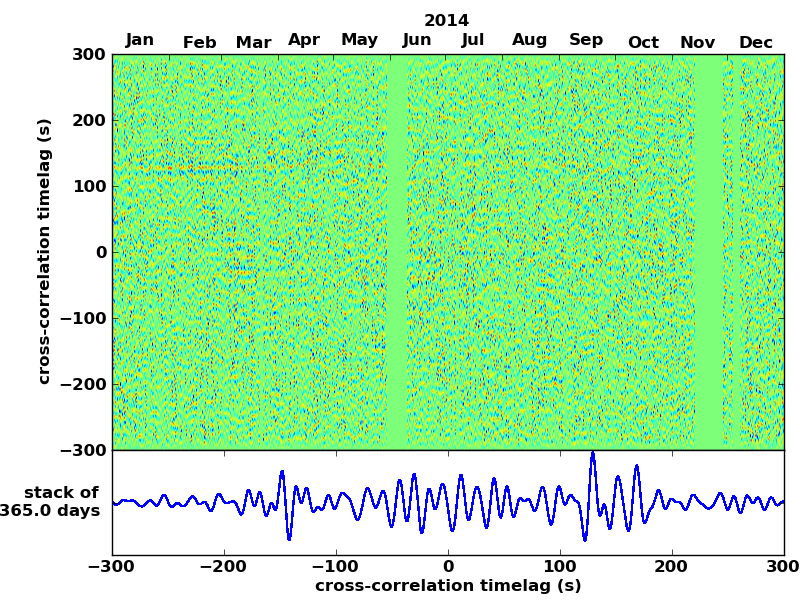
High frequency band-pass of EDI-FOEL
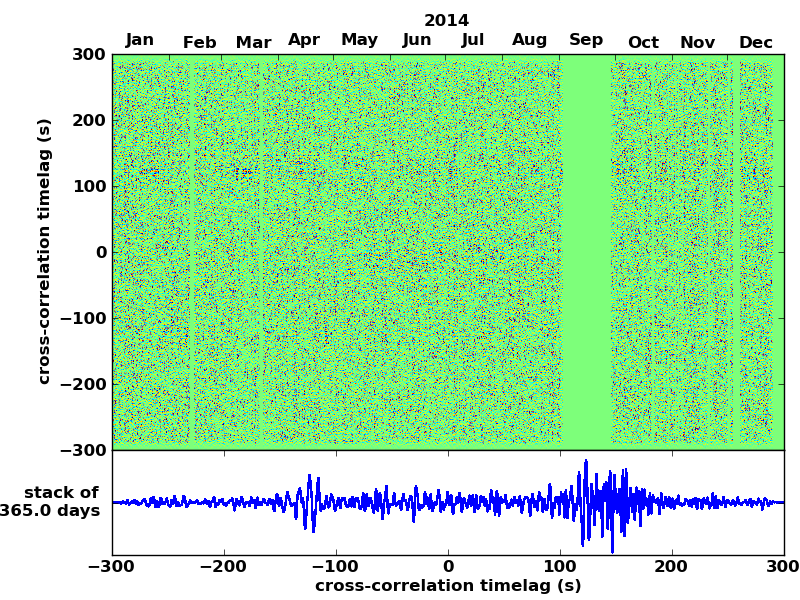
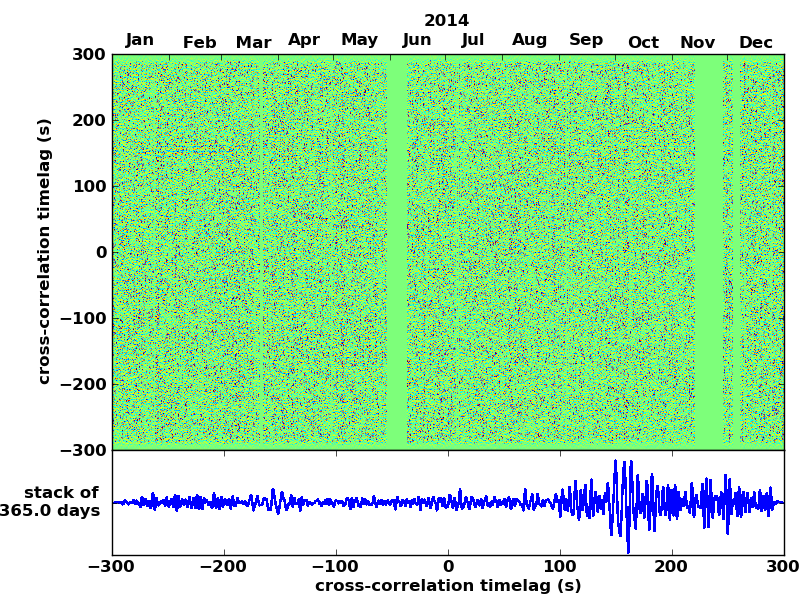
Station pair – EDI-FOEL, 0.09-0.50 Hz, 1 hour running average
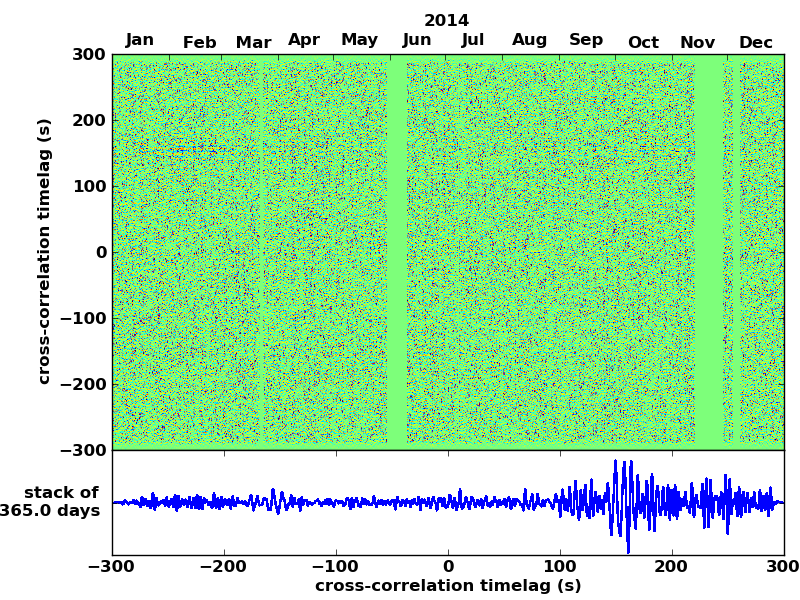
Station pair – EDI-FOEL, 0.09-0.50 Hz, 2 hour running average
Station pair – EDI-FOEL, 0.09-0.50 Hz, 6 hour running average
Station pair – EDI-FOEL, 0.09-0.50 Hz, 12 hour running average
Station pair – EDI-FOEL, 0.09-0.50 Hz, 24 hour running average
Station pair – EDI-FOEL, 0.09-0.50 Hz, 48 hour running average
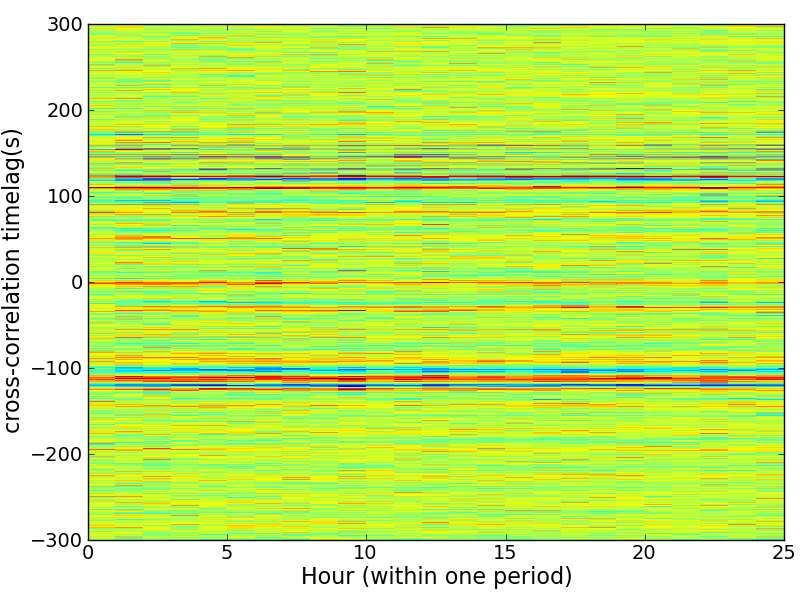
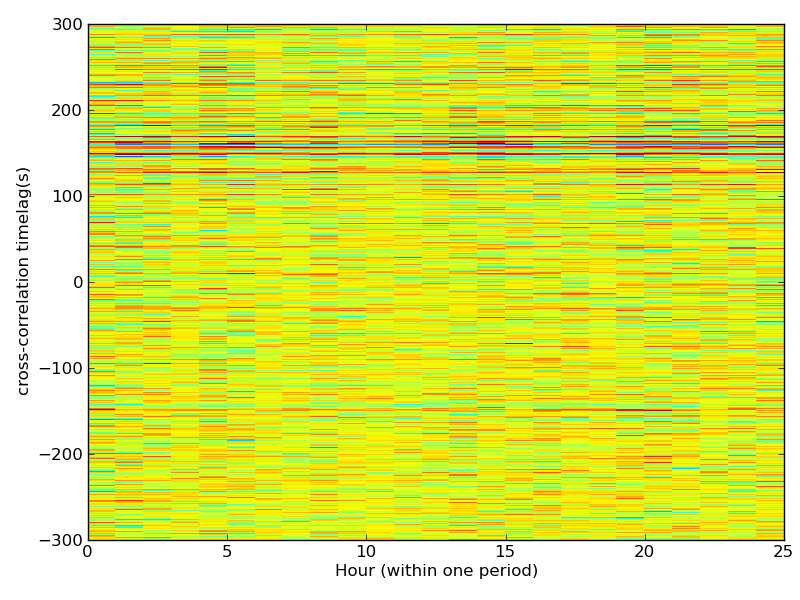
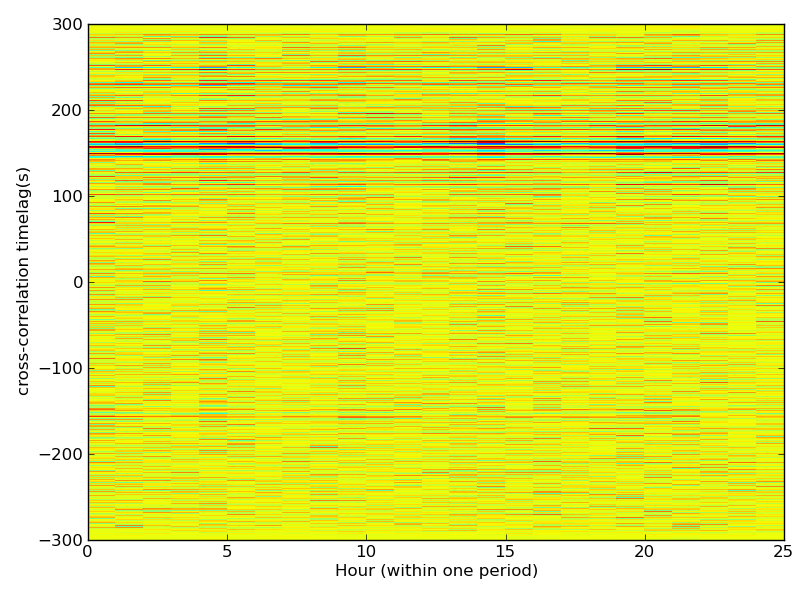
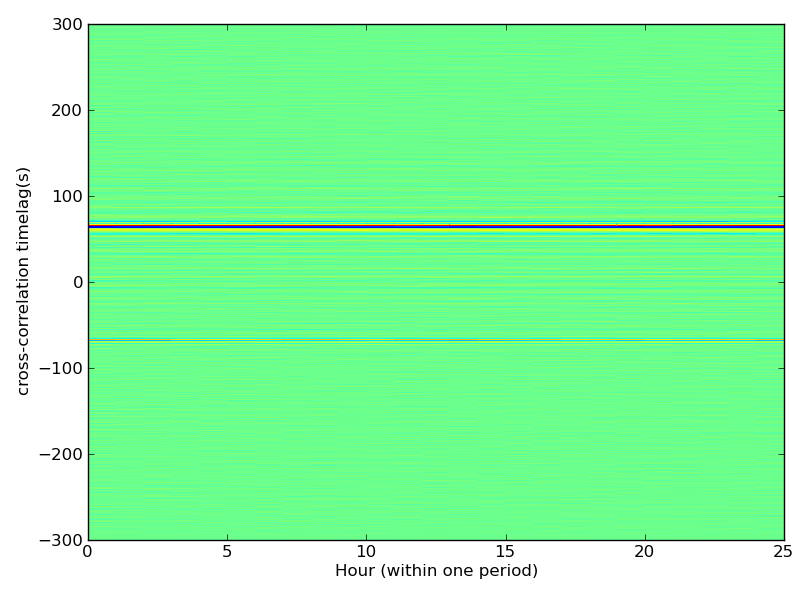
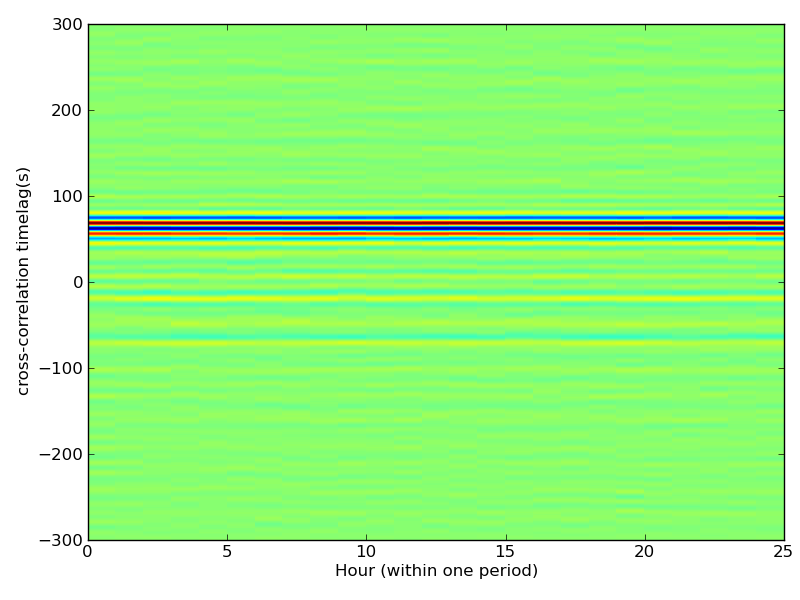
Temporal variations caused by Earth tides.
All available traces stacked into 25 bins according to their relative hour within one lunar tidal period of 24.8412 hours.
This period involves two high and two low tides, so if there is periodicity in the seismic velocities the signals are expected to follow similar pattern.
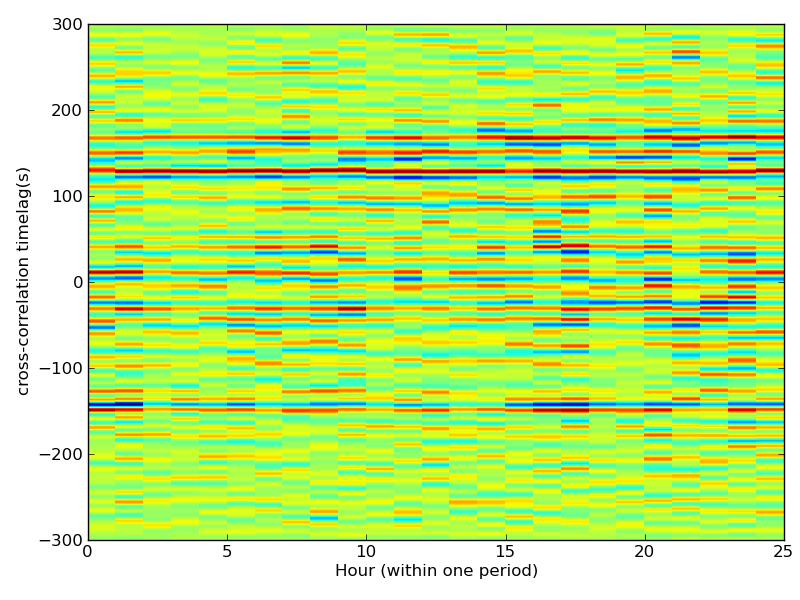
Station pair – EDI-FOEL, 0.02-1,00 Hz. No variation can be observed, but band-passing the signal could reveal existing changes.
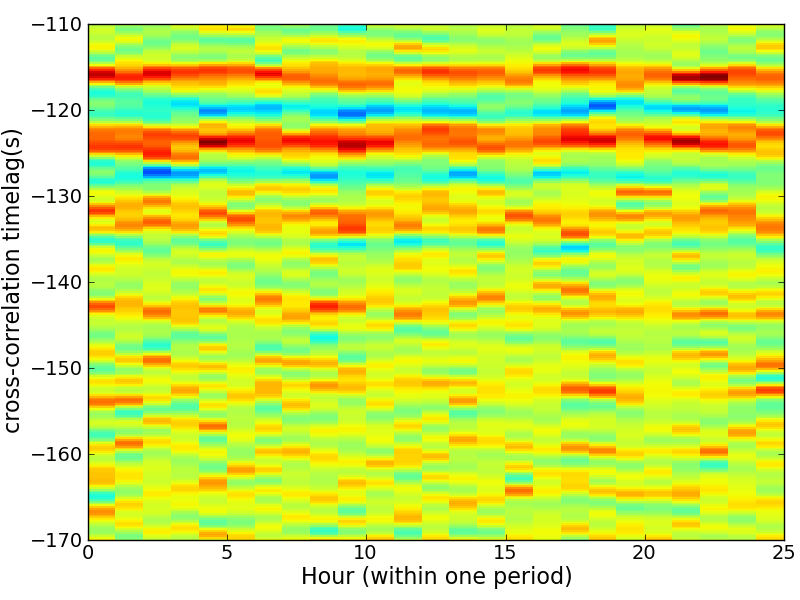
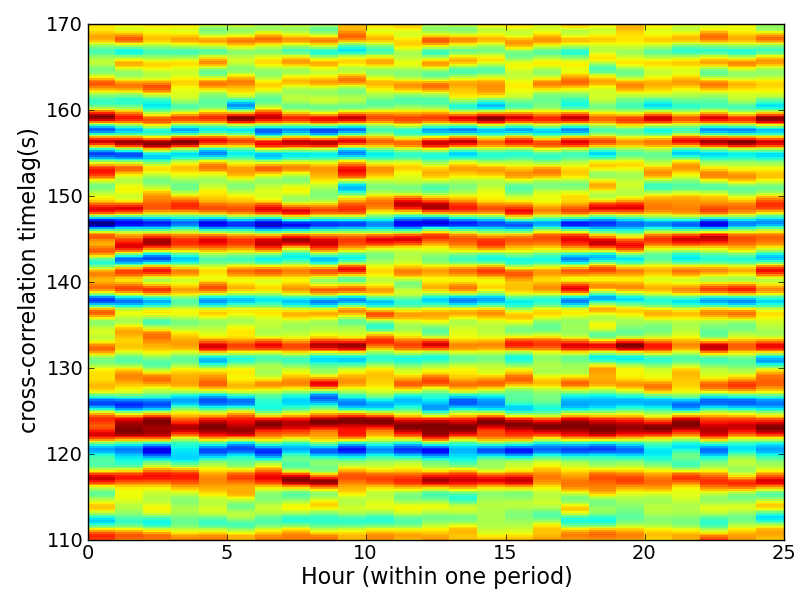
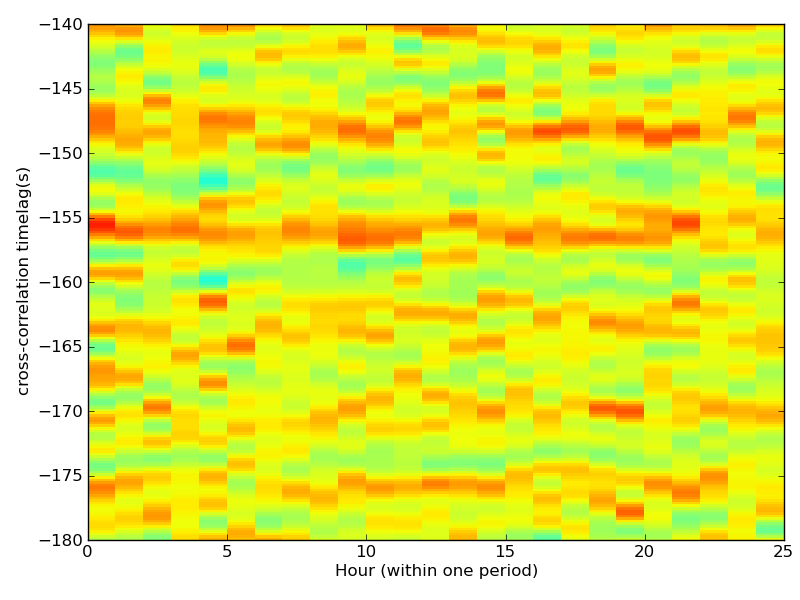
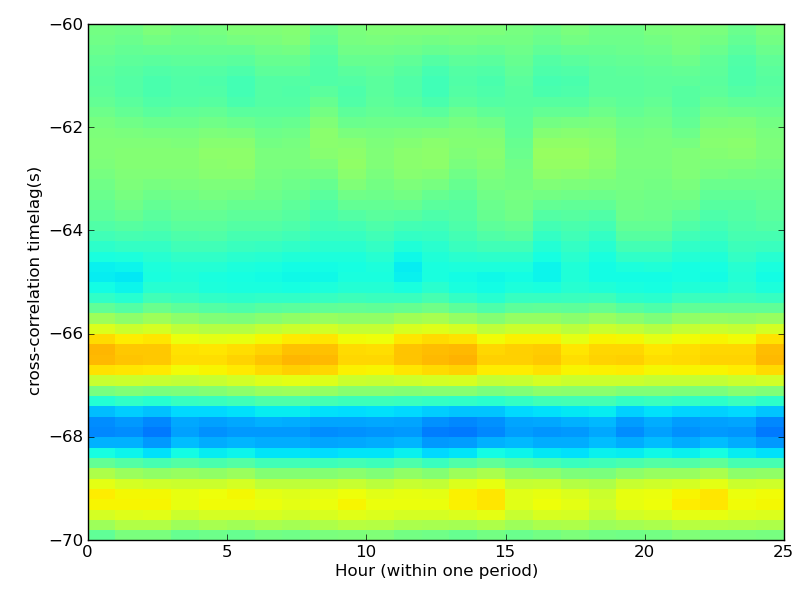
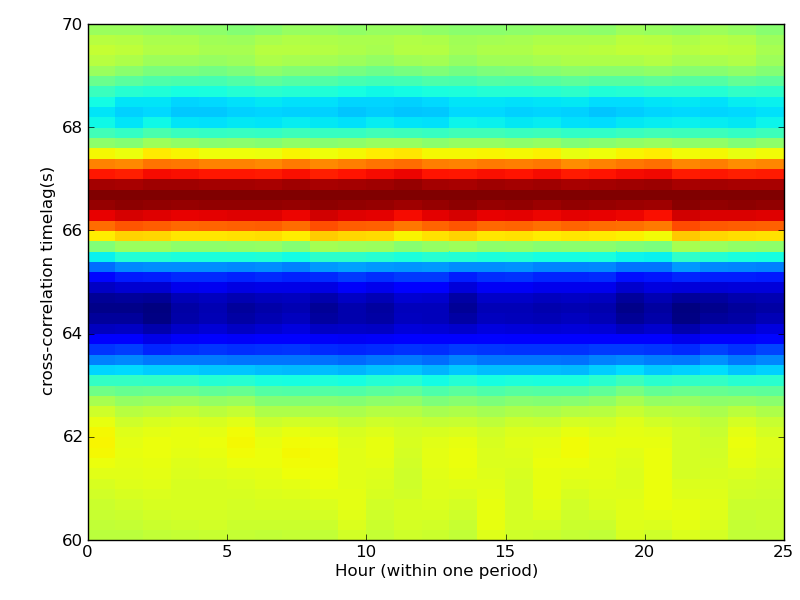
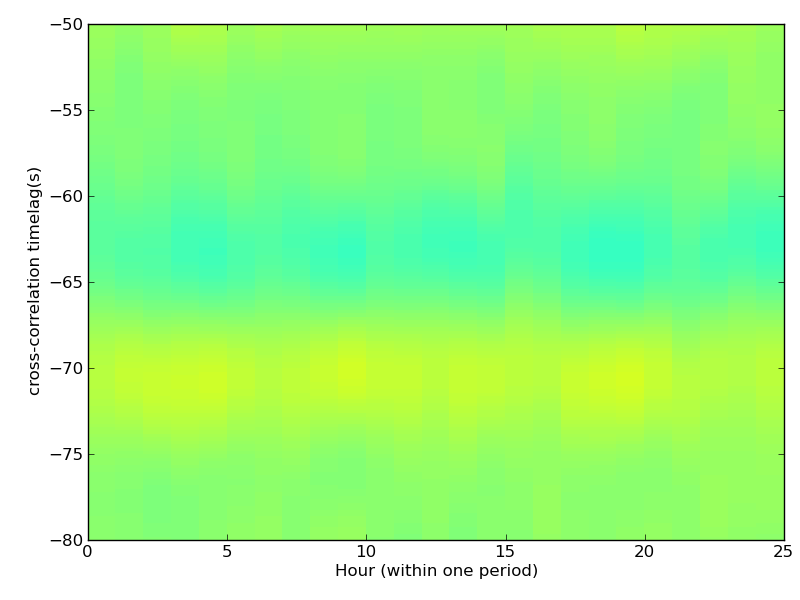
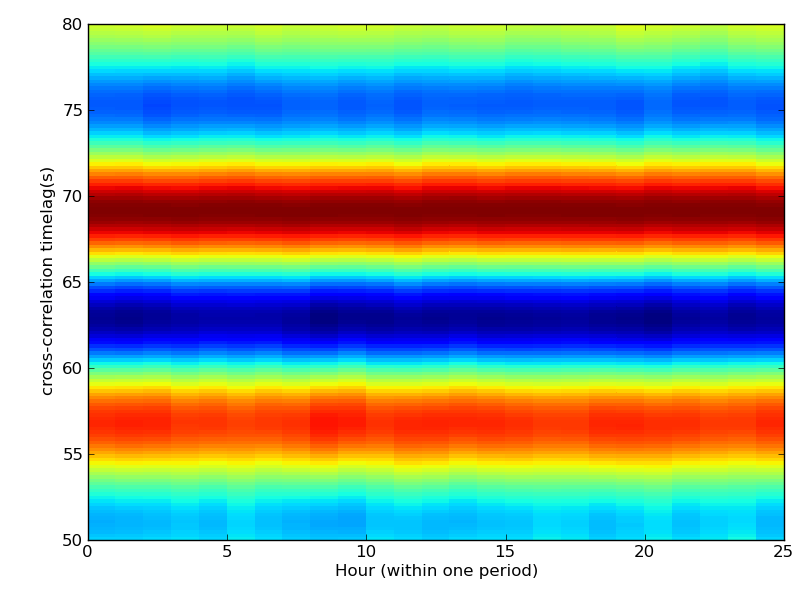
Station pair – EDI-FOEL, 0.09-0.50 Hz. No variation can be observed, zooming into specific parts of the signal might help.
Station pair – EDI-FOEL, 0.09-0.50 Hz. Zoomed into the anticausal part of the cross-correlations, some variation is observed but periodicity cannot be exactly defined.
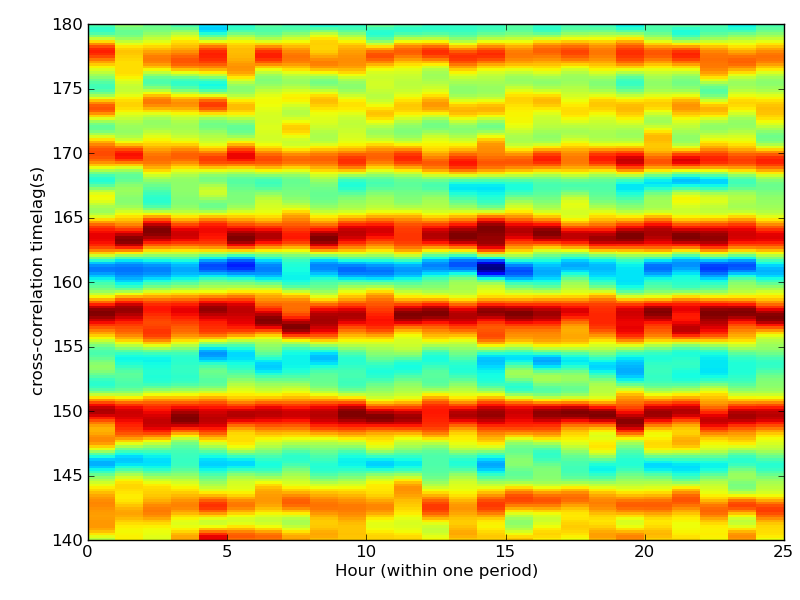
Station pair – EDI-FOEL, 0.09-0.50 Hz. Zoomed into the causal part of the cross-correlations, some variation is observed but periodicity cannot be exactly defined.
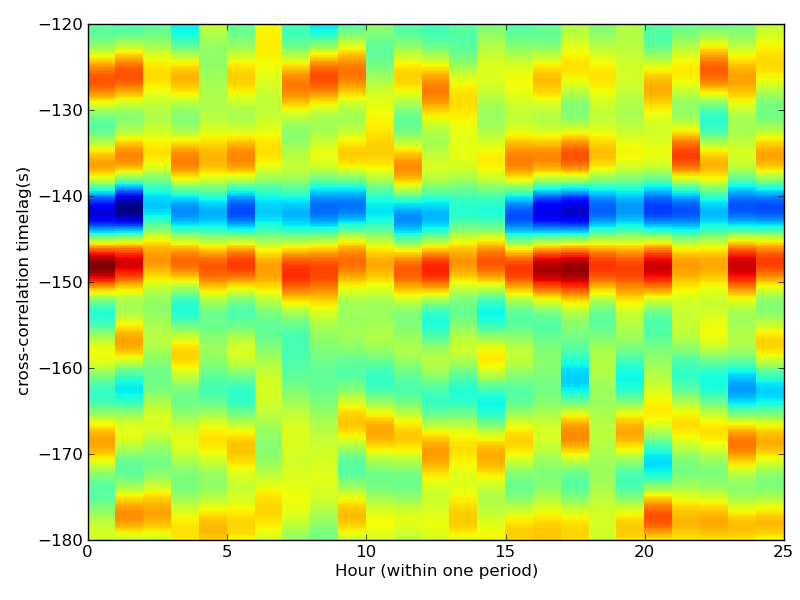
Station pair – EDI-FOEL, 0.02-0.11 Hz. No variation can be observed, zooming into specific parts of the signal might help.
Station pair – EDI-FOEL, 0.02-0.11 Hz. Zoomed into the anticausal part of the cross-correlations, some variation is observed but periodicity cannot be exactly defined.
Station pair – EDI-FOEL, 0.02-0.11 Hz. Zoomed into the causal part of the cross-correlations, some variation is observed but periodicity cannot be exactly defined.
HTL-ELSH
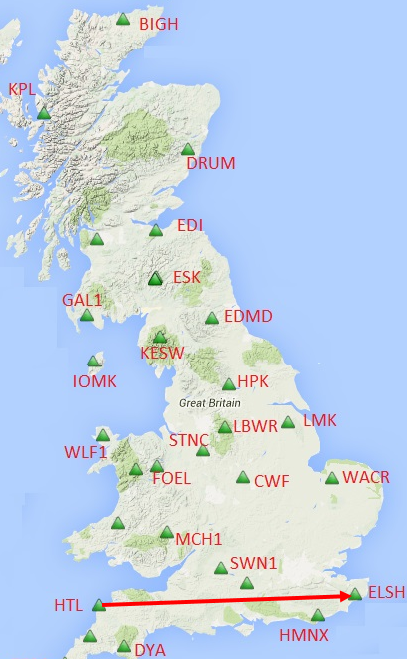
Map, showing the direction of cross-correlation between station pair HTL-ELSH with the resulting cross-correlation gathers below.
Full frequency spectrum of HTL-ELSH
Station pair – HTL-ELSH, 0.02-1.00 Hz, 1 hour running average
Station pair – HTL-ELSH, 0.02-1.00 Hz, 2 hour running average
Station pair – HTL-ELSH, 0.02-1.00 Hz, 6 hour running average
Station pair – HTL-ELSH, 0.02-1.00 Hz, 12 hour running average
Station pair – HTL-ELSH, 0.02-1.00 Hz, 24 hour running average
Station pair – HTL-ELSH, 0.02-1.00 Hz, 48 hour running average
Low frequency band-pass of HTL-ELSH
Station pair – HTL-ELSH, 0.02-0.11 Hz, 1 hour running average
Station pair – HTL-ELSH, 0.02-0.11 Hz, 2 hour running average
Station pair – HTL-ELSH, 0.02-0.11 Hz, 6 hour running average
Station pair – HTL-ELSH, 0.02-0.11 Hz, 12 hour running average
Station pair – HTL-ELSH, 0.02-0.11 Hz, 24 hour running average
Station pair – HTL-ELSH, 0.02-0.11 Hz, 48 hour running average
High frequency band-pass of HTL-ELSH
Station pair – HTL-ELSH, 0.09-0.50 Hz, 1 hour running average
Station pair – HTL-ELSH, 0.09-0.50 Hz, 2 hour running average
Station pair – HTL-ELSH, 0.09-0.50 Hz, 6 hour running average
Station pair – HTL-ELSH, 0.09-0.50 Hz, 12 hour running average
Station pair – HTL-ELSH, 0.09-0.50 Hz, 24 hour running average
Station pair – HTL-ELSH, 0.09-0.50 Hz, 48 hour running average
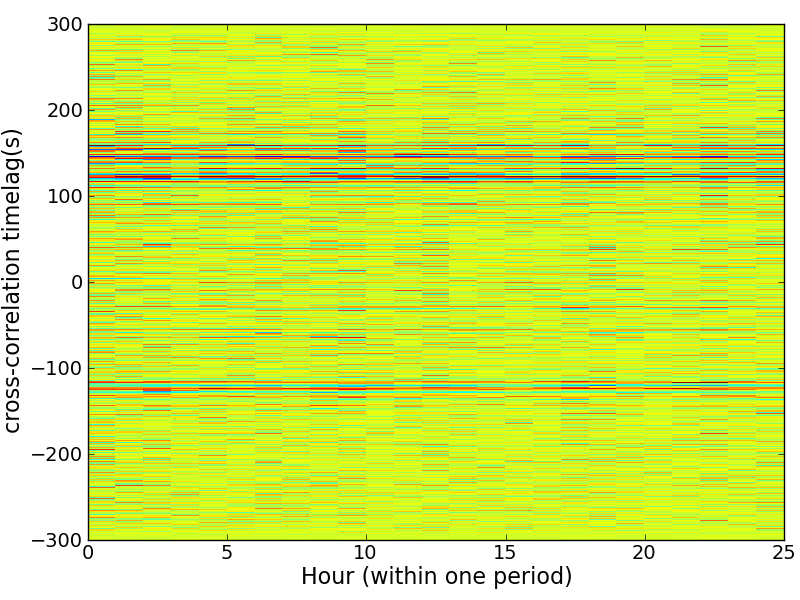
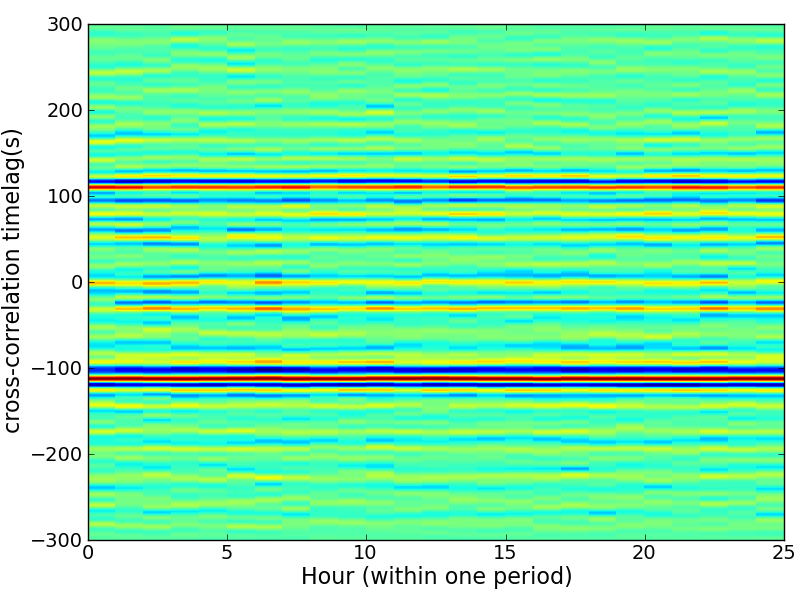
Temporal variations caused by Earth tides
All available traces stacked into 25 bins according to their relative hour within one lunar tidal period of 24.8412 hours.
This period involves two high and two low tides, so if there is periodicity in the seismic velocities the signals are expected to follow similar pattern.
Station pair – HTL-ELSH, 0.02-1,00 Hz. No variation can be observed, but band-passing the signal could reveal existing changes.
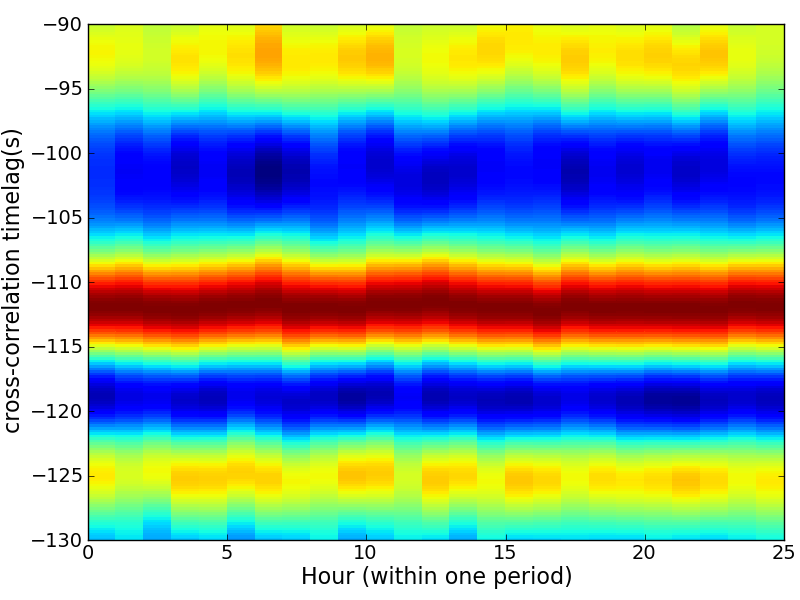
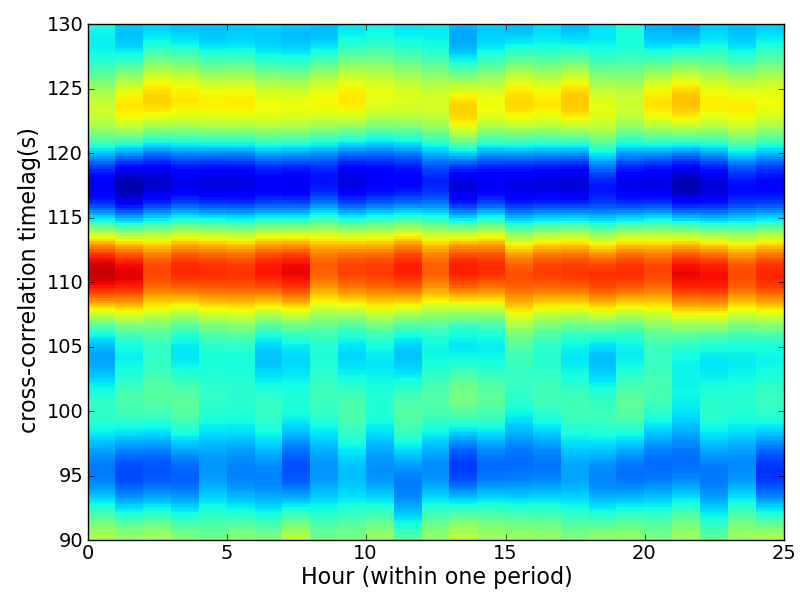
Station pair – HTL-ELSH, 0.09-0.50 Hz. No variation can be observed, zooming into specific parts of the signal might help.
Station pair – HTL-ELSH, 0.09-0.50 Hz. Zoomed into the anticausal part of the cross-correlations, some variation is observed but periodicity cannot be exactly defined.
Station pair – HTL-ELSH, 0.09-0.50 Hz. Zoomed into the causal part of the cross-correlations, some variation is observed but periodicity cannot be exactly defined.
Station pair – HTL-ELSH, 0.02-0.11 Hz. No variation can be observed, zooming into specific parts of the signal might help.
Station pair – HTL-ELSH, 0.02-0.11 Hz. Zoomed into the anticausal part of the cross-correlations, some variation is observed but periodicity cannot be exactly defined.
Station pair – HTL-ELSH, 0.02-0.11 Hz. Zoomed into the causal part of the cross-correlations, some variation is observed but periodicity cannot be exactly defined.
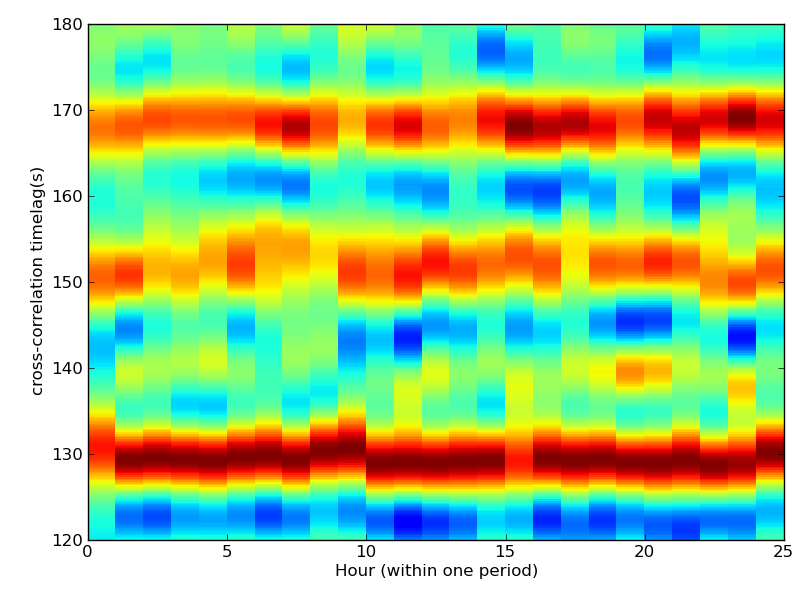
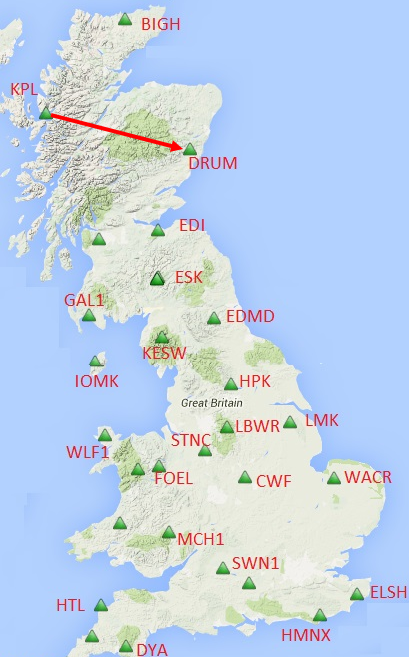
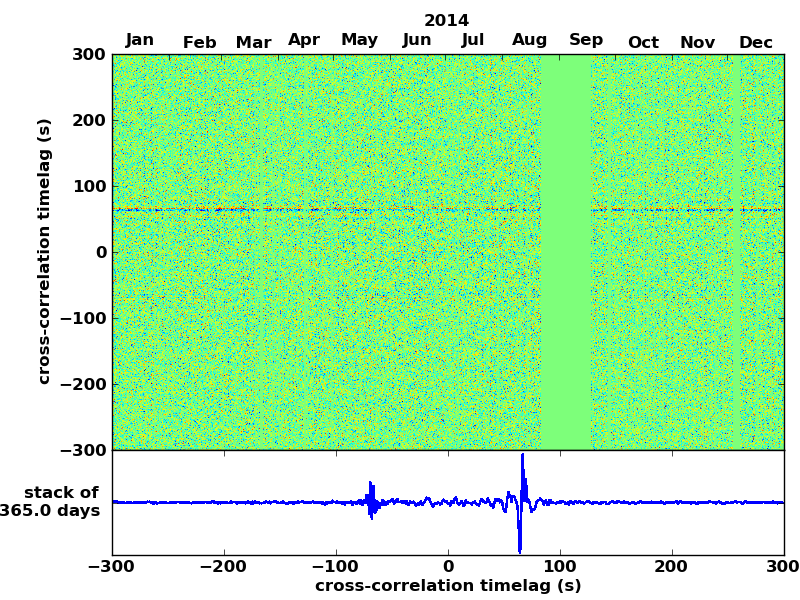
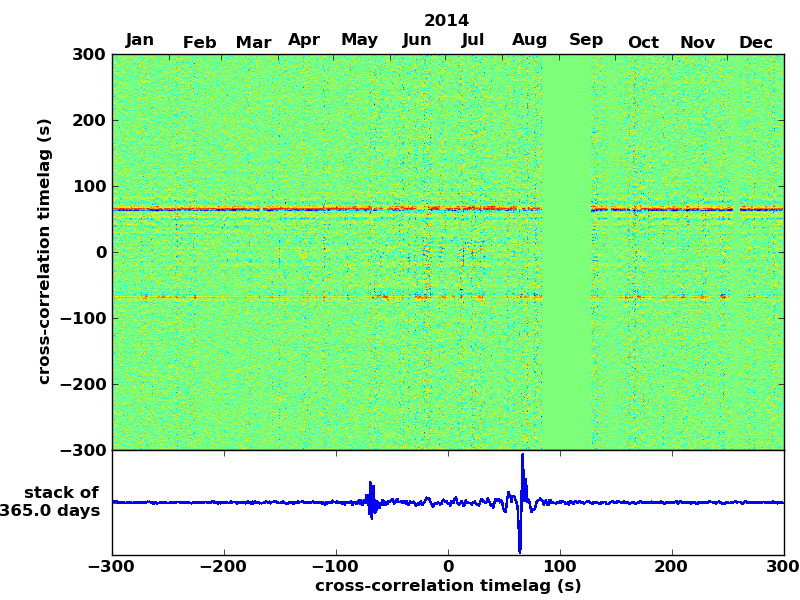
KPL-DRUM
Map, showing the direction of cross-correlation between station pair KPL-DRUM with the resulting cross-correlation gathers below.
Full frequency spectrum of KPL-DRUM
Station pair – KPL-DRUM, 0.02-1.00 Hz, 1 hour running average
Station pair – KPL-DRUM, 0.02-1.00 Hz, 2 hour running average
Station pair – KPL-DRUM, 0.02-1.00 Hz, 6 hour running average
Station pair – KPL-DRUM, 0.02-1.00 Hz, 12 hour running average
Station pair – KPL-DRUM, 0.02-1.00 Hz, 24 hour running average
Station pair – KPL-DRUM, 0.02-1.00 Hz, 48 hour running average
Low frequency spectrum of KPL-DRUM
Station pair – KPL-DRUM, 0.02-0.11 Hz, 1 hour running average
Station pair – KPL-DRUM, 0.02-0.11 Hz, 2 hour running average
Station pair – KPL-DRUM, 0.02-0.11 Hz, 6 hour running average
Station pair – KPL-DRUM, 0.02-0.11 Hz, 12 hour running average
Station pair – KPL-DRUM, 0.02-0.11 Hz, 24 hour running average
Station pair – KPL-DRUM, 0.02-0.11 Hz, 48 hour running average
High frequency band-pass of KPL-DRUM
Station pair – KPL-DRUM, 0.09-0.50 Hz, 1 hour running average
Station pair – KPL-DRUM, 0.09-0.50 Hz, 2 hour running average
Station pair – KPL-DRUM, 0.09-0.50 Hz, 6 hour running average
Station pair – KPL-DRUM, 0.09-0.50 Hz, 12 hour running average
Station pair – KPL-DRUM, 0.09-0.50 Hz, 24 hour running average
Station pair – KPL-DRUM, 0.09-0.50 Hz, 48 hour running average
Temporal variations caused by Earth tides
All available traces stacked into 25 bins according to their relative hour within one lunar tidal period of 24.8412 hours.
This period involves two high and two low tides, so if there is periodicity in the seismic velocities the signals are expected to follow similar pattern.
Station pair – KPL-DRUM, 0.02-1,00 Hz. No variation can be observed, but band-passing the signal could reveal existing changes.
Station pair – KPL-DRUM, 0.09-0.50 Hz. No variation can be observed, zooming into specific parts of the signal might help.
Station pair – KPL-DRUM, 0.09-0.50 Hz. Zoomed into the anticausal part of the cross-correlations, but there is no visible variation in the signal.
Station pair – KPL-DRUM, 0.09-0.50 Hz. Zoomed into the causal part of the cross-correlations, but there is no visible variation in the signal.
Station pair – KPL-DRUM, 0.02-0.11 Hz. No variation can be observed, zooming into specific parts of the signal might help.
Station pair – KPL-DRUM, 0.02-0.11 Hz. Zoomed into the anticausal part of the cross-correlations, but there is no visible variation in the signal.
Station pair – KPL-DRUM, 0.02-0.11 Hz. Zoomed into the causal part of the cross-correlations, but there is no visible variation in the signal.